Open Source  ·  Zero Dependencies  ·  Single File

Full visibility
into your
Raspberry Pi.
In real time.

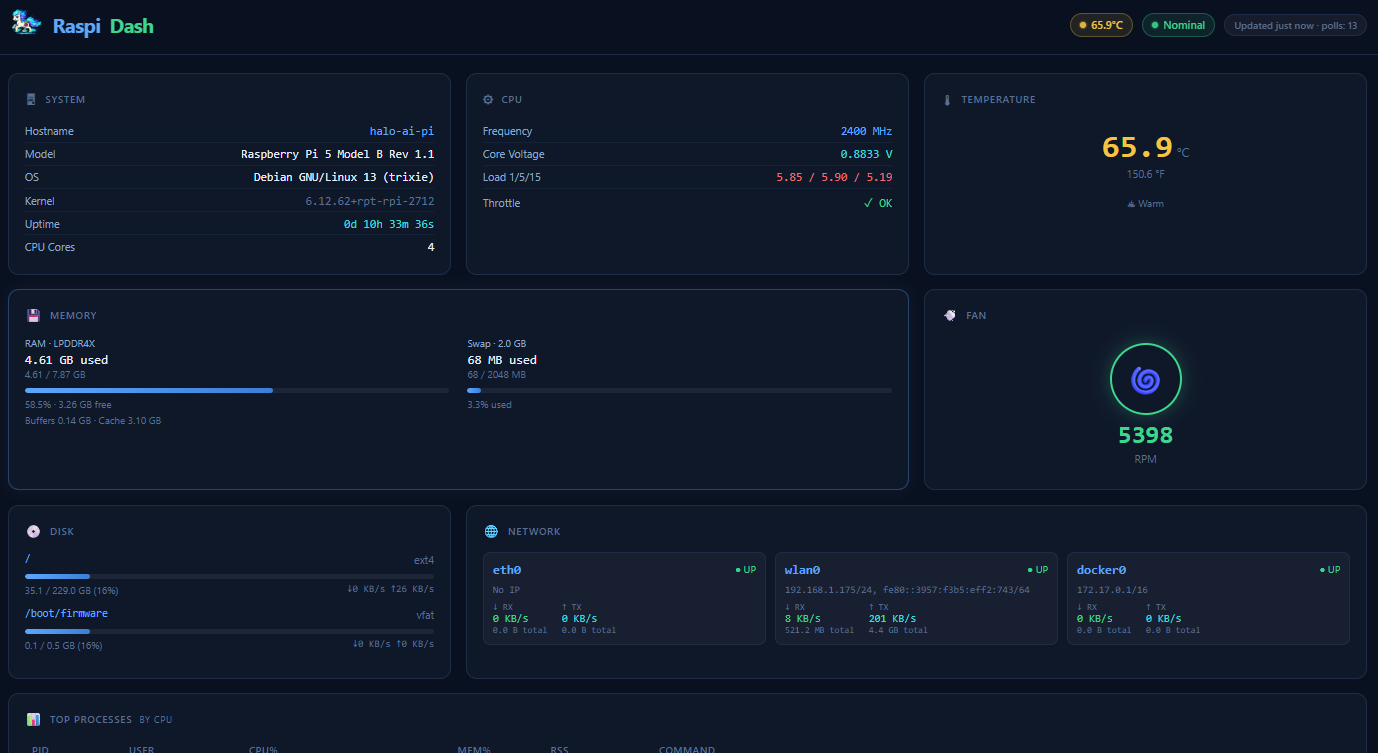
RaspiDash is a single Python file that turns any Raspberry Pi into a live system dashboard. CPU, temperature, memory, disk, GPIO pins, Docker, services — all in one browser tab. No npm. No build step. No config files.

CPU 34%
Temp 52.1°C
RAM 1.8 GB
Net RX 2.4 MB/s
http://raspberrypi.local:8766
RaspiDash live system dashboard showing Raspberry Pi 5 metrics including CPU usage, temperature, memory, disk, network, GPIO pins and more
13
monitoring cards
2s
auto-refresh interval
0
frontend dependencies
1
Python file to run

// monitoring cards

Everything your Pi exposes,
surfaced and readable.

Every card pulls data directly from the Pi's own kernel interfaces — no agents, no collectors, no databases. Pure signal.

🖥️
System
Hostname, Pi model, OS version, kernel, uptime, and CPU core count at a glance.
/proc/device-tree
CPU
Per-core utilization, clock frequency, core voltage, throttle flags, and 1/5/15 load averages.
vcgencmd
🌡️
Temperature
CPU and RP1 bridge chip temps in °C and °F with color-coded status badges.
vcgencmd measure_temp
🧠
Memory
RAM and swap with animated fill bars — used, cached, available, and total.
/proc/meminfo
💾
Disk
All mounted filesystems with usage bars and live read/write I/O rates per device.
/proc/diskstats
🌐
Network
Per-interface IP, link state, RX/TX rates, and cumulative error counts — updated every 2 seconds.
/proc/net/dev
🌀
Fan
Live RPM via sysfs hwmon with an animated ring indicator and GPIO fan mode control buttons.
hwmon sysfs
📋
Processes
Top 15 processes by CPU — PID, user, %CPU, %MEM, and command name with inline usage bars.
/proc/*/stat
⚙️
Services
All systemd units grouped by state — running, failed, and inactive — color-coded for instant triage.
systemctl
📌
GPIO Pin Map
Live 40-pin header visualization showing BCM number, direction, pull state, logic level, and alt-function per pin.
pinctrl
🔌
USB Devices
All connected USB devices with vendor/product IDs and human-readable device descriptors.
lsusb
🐳
Docker
Running containers with name, image, and status. Hidden gracefully if Docker isn't installed.
docker ps
🎮
GPU
VideoCore GPU memory allocation and current usage reported directly by the Pi firmware.
vcgencmd

// gpio pin map

The only Pi dashboard with a live 40-pin header.

See every GPIO pin's direction, pull resistor, voltage level, and alternate function — live, from any browser on your network. No guessing. No multimeter.

  • Input pins in green Shows hi/lo voltage level with a live glowing dot indicator
  • Output pins in blue Direction and pull resistor state — up, down, or none
  • Alt-function pins in purple SPI, I2C, UART, PWM — shown by function name automatically
GPIO 40-pin header  ·  live

// quick start

Up and running in 60 seconds.

Three commands. That's it. Works on any Raspberry Pi running Raspberry Pi OS.

STEP 01
Clone the repo
Pull the project onto your Pi. No submodules, no package manager dance.
$ git clone https://github.com/
  kristoffersingleton/raspi-dash
Cloning into 'raspi-dash'...
done.
STEP 02
Install Flask
Flask is the only dependency — everything else reads directly from the Pi's kernel interfaces.
$ cd raspi-dash
$ pip install flask
Successfully installed flask
STEP 03
Launch and browse
Open a browser on any device on your local network. Your Pi's whole story, in one tab.
$ python server.py
* Running on http://0.0.0.0:8766
# open in any browser on your network